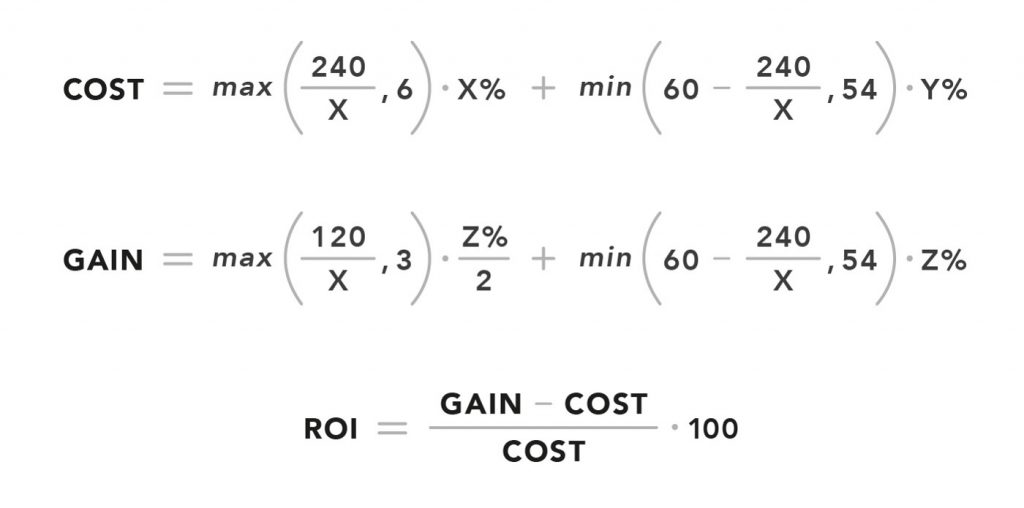
Our design system ROI formula has two components:
- What you’ll gain over time from the design system you build;
- What building and maintaining will cost you.
Having calculated these two components, it’s straightforward to use them in the standard formula to calculate ROI. In the following, we’ll explain all of the different parts in more detail.
Assumptions
Our formula orients at the ‘Design System Efficiency Curve,’ i.e., at first, you’ll see a drop in productivity due to the necessary upfront investment. Still, after a break-even point where the design system has grown enough to compensate for that, productivity gains are significant.
For a specific formula, however, it’s necessary to make some (conservative but adjustable) assumptions. In our case, we have agreed on the general assumptions below in discussions within a design system task force comprising representatives from our design and engineering teams at BestSecret Group.
- A design system is ‘good’ for five years (=
60months). That is, we anticipate a major revamp roughly every five years, e.g., due to a change in brand identity. This is where the60in the formula comes from. We’re well aware that a brand redesign is, of course, no reason to throw away everything and start from scratch again and that a design system might even make a rebrand much easier. However, please bear in mind that we want to make very conservative assumptions here and that if a business decides to shake up things, it would still be necessary to adjust a lot of things in a design system that go beyond pure day-to-day maintenance. - The estimate of our designers and engineers was that if one initially invests 20% of their time into building the design system, it will take them 12 months to get it up and running. If they invest less or more, the ramp-up phase will become longer or shorter in a linear manner because a given design system will always need the same amount of effort put into it. Please note that this assumption varies with the amount of person-power a company could put into a design system. Obviously, if there are 200 designers and 200 developers who could all spend 20% of their time on a design system, things might move much faster than 12 months, and the
240and120in the formula could be tweaked accordingly. We consider our assumption reasonable for an ‘average’ set-up with ~10 designers and ~30 developers (plus/minus). - However, a design system takes at least
6months to set up. Anything less would be unrealistic in a real-world setting (due to coordination and alignment efforts), and we anticipated that probably no business would agree to invest more than 40% of designers’ or developers’ time in setting up a design system. That’s why we have included the max and min functions in the formula, and that’s where the6and54(60 months minus 6 months) come from. - For the first half of the ramp-up phase, we have no productivity gains yet.
- For the second half of the ramp-up phase, we have 50% productivity gains. That’s why we have
3instead of6in the gain part of the formula. - After the ramp-up phase, we have full productivity gains.
With these assumptions in place, we can now have a look at what the parameters X, Y, and Z mean.
Parameters
X denotes the percentage of time invested in building the design system. If X=20, the formula gives us 240⁄20=12 months of ramp-up phase.
Note: For X<4.62, the formula “breaks down” since the ramp-up phase would be ≥5 years.
Y denotes the percentage of time invested in ongoing maintenance after the ramp-up phase. In our specific case, we assumed 0.5X, but essentially, Y could be anything.
Z denotes the amount of time saved by using the design system in percent. This is equal to productivity or efficiency gains.
X and Y are relatively straightforward to specify: you ‘just’ have to agree on how much time you want to / can spend taking care of the design system. However, Z is a different story. Since it’s the productivity gain yielded by the design system, it’s impossible to know the parameter precisely beforehand. So, how can we estimate Z in a meaningful way? Essentially, this is a predictive judgment, so we followed the advice by Kahneman et al. (2021) — considering the base rate of design system productivity gains by doing a literature review and averaging the numbers reported.
The existing studies about design system productivity gains we found most convincing were Klüver (2019), Loomer (2016), Ray (2018), Slack (2019), and Sparkbox (n.d.).
Klüver (2019), Ray (2018), and Slack (2019) report 50%, 31%, and 34% better efficiency for design teams, which means an average of Z=38.
Klüver (2019), Loomer (2016), and Sparkbox (n.d.) report 25%, 20%, and 47% better efficiency for development teams, which means an average of Z=31.
Hence, in our case, we calculated ROI separately for design and development teams with the two different values for Z, and then aggregated it afterwards. In the next section, we’ll guide you through how exactly that works.
Example
Acme, Inc. has a team of 5 designers and a team of 10 developers who want to kick off building a design system together. They want to prove that the gains yielded by a design system in the mid- to long-term far exceed the necessary investment. Therefore, they grab the design system ROI formula and get going.
They estimate that everyone would probably be able to invest 30% (X=30) of their time during the ramp-up phase and afterwards 10% (Y=10) for maintenance. They moreover rely on the above base rates for productivity gains (Z=38 for design, Z=31 for development). They start with the ROI for the design team over the next five years.
Design
On the cost side, 30% time investment means the ramp-up phase would be 240/30 = 8 months long. That is, 8*30% = 2.4 months would be effectively spent on building the design system. Afterwards, 60-8 = 52 months remain for the 5-year period, and of those, 52*10% = 5.2 months would be effectively spent on maintenance. Overall, there would be 7.6 months (out of five years) of work put into the design system.

On the gain side, a ramp-up phase of 8 months would mean four months of half the productivity gains. That is 4*(38%/2) = 0.76 months. Afterwards, for the remaining 52 months, we would see full productivity gains, i.e., 52*38% = 19.76 months. Overall, the design system would therefore save the design team 20.52 months of needless work.

Together with the 7.6 months of work spent on building and maintaining the design system, this yields an ROI of (20.52-7.6)/7.6 = 170%. In other words, you get $2.70 back for every dollar invested in the design system.
If one designer costs $5,000 a month, that means the design system would cost Acme, Inc. 7.6*$5,000*5 = $190,000 while it would save them 20.52*$5,000*5 = $513,000 when looking at the design team alone.
Development
Doing the same thing for development is relatively straightforward based on the above. Since the designers and developers at Acme, Inc. agreed on everyone investing 30% for ramp-up and 10% for maintenance, the cost side stays exactly the same. Like the designers, the developers will be busy with the design system for effectively 7.6 months over five years.
On the gain side, however, we have to exchange the value for Z, from 38 to 31. Luckily, that’s the only thing, and the rest remains as above.

So, in the case of development, we’d invest 7.6 months and save 16.74 months of unnecessary work. This gives us an ROI of (16.74-7.6)/7.6 = 120%.
If one developer costs $6,000 a month, that means the design system would cost Acme, Inc. 7.6*$6,000*10 = $456,000 while it would save them a whooping 16.74*$6,000*10 = $1,004,400 when looking at the development team alone.
Bringing It All Together
Combining the calculations for design and development, therefore, yields the following:
Design:
- costs = $190,000
- gains = $513,000
- ROI = 170%
Development:
- costs = $456,000
- gains = $1,004,400
- ROI = 120%
Total:
- costs = $646,000
- gains = $1,517,400 (net gains = $871,400)
- ROI = (1,517,400–646,000) / 646,000 = 135%
To top things off and make them look more like an approximation, you can round the final numbers and indicate the error. We’ve played around with some variance in the parameters (please feel free to do so on your own) and for the final result, ±25% seems to be reasonable. For instance, “we estimate 135% ROI and $900,000 (±225,000) net gains from the design system over five years.”